empty
17.11.2022 01:34 PM
Technical analysis of EUR/USD for November 17, 2022

This image is no longer relevant

Overview :

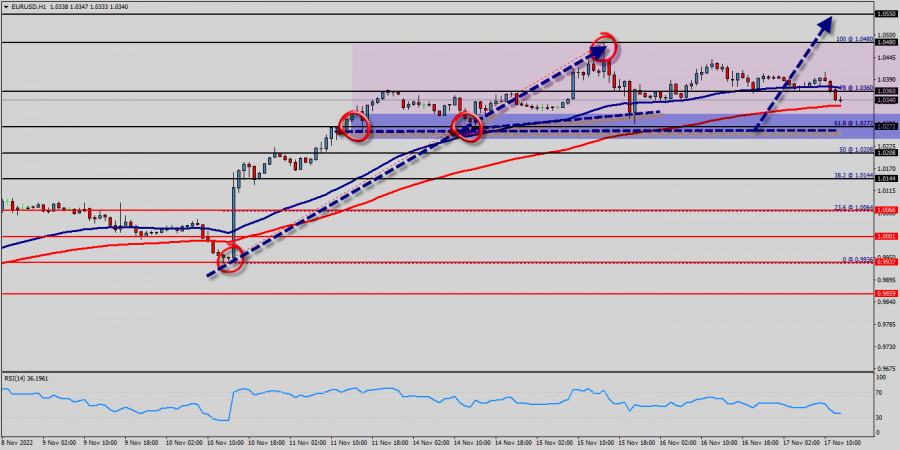
The EUR/USD pair's rise from 1.0272 is still in progress and intraday bias stays on the upside for 1.0272 resistance first on the one-hour chart. All elements being clearly bullish market, it would be possible for traders to trade only long positions on the EUR/USD pair as long as the price remains well above the price of 1.0272. The EUR/USD pair will continue rising from the level of 1.0272 in the long term. It should be noted that the support is established at the level of 1.0272 which represents the daily pivot point. The price is likely to form a double bottom in the same time frame. Accordingly, the EUR/USD pair is showing signs of strength following a breakout of the highest level of 1.0340. This suggests that the pair will probably go up in coming hours.

If the trend is able to break the level of 1.0340, then the market will call for a strong bullish market towards the objectives between 1.0272 ans 1.0480 this week. Currently, the price is in a bullish channel. This is confirmed by the RSI indicator signaling that we are still in a bullish trending market. As the price is still above the moving average (100), immediate support is seen at 1.0272, which coincides with a key ratio (61.8% of Fibonacci). The EUR/USD pair swing around the breached resistance of the bullish channel and keeps its stability above it until now, noticing that the EMA50 continues to resistance the price from above, while RSI begins to overlap positively.

Thus, the market is indicating a bullish opportunity above the above-mentioned support levels, for that the bullish outlook remains the same as long as the 100 EMA is headed to the upside. So, buy above the level of 1.0340 with the first target at 1.0360 in order to test the daily resistance 1. The buyers' bullish objective is set at the level of 1.0480. A bullish break in this resistance would boost the bullish momentum. The buyers could then target the resistance located at 1.0480. If there is any crossing, the next objective would be the resistance located at 1.0480. The level of 1.0550 is a good place to take profits.

Moreover, the RSI is still signaling that the trend is upward as it remains strong above the moving average (100). However, beware of bullish excesses that could lead to a possible short-term correction; but this possible correction would not be tradeable.

On the other hand, in case a reversal takes place and the EUR/USD pair breaks through the support level of 1.0272, a further decline to 1.0208 and 1.0144 can occur. It would indicate a bearish market.

Mourad El Keddani,
الخبير التحليلي لدى شركة إنستافوركس
© 2007-2025
حدد الإطار الزمني
5
د
15
د
30
د
1
س
4
ساعات
1
يوم
1
أسبوع
كسب عائد من تغيرات أسعار العملات المشفرة مع إنستافوركس.
قم بتحميل منصة التداول ميتاتريدر 4 وافتح أول صفقة.
  • إيداع الحظ
    قم بإيداع 3,000 دولار في حسابك واحصل على $1,000 وأكثر من ذالك!
    في أبريل نحن نقدم باليانصيب $1,000 ضمن حملة إيداع الحظ!
    احصل على فرصة للفوز من خلال إيداع 3,000 دولار في حساب تداول. بعد أن استوفيت هذا الشرط، تصبح مشاركًا في الحملة.
    انضم إلى المسابقة

المقالات الموصى بها

اليورو/الدولار الأمريكي – 3 أبريل: الدولار يعاني من انهيار آخر

يوم الأربعاء، ارتفع زوج اليورو/الدولار الأمريكي بشكل حاد. بالكاد يمكن وصف هذه الحركة بأنها مجرد ارتفاع. عندما يتعلق الأمر بالدولار الأمريكي، كان ذلك انهيارًا آخر - واحدًا من العديد

Samir Klishi 11:25 2025-04-03 UTC+2

GBP/USD – 3 أبريل: نهاية بلا جدوى للأسبوع بالنسبة للدولار

على الرسم البياني الساعي، ارتفع زوج الجنيه الإسترليني/الدولار الأمريكي مرة أخرى، مخترقًا العديد من المستويات ومناطق المقاومة. في هذه المرحلة، ارتفع الجنيه الإسترليني بمقدار 220 نقطة، والسعر يقترب من مستوى

Samir Klishi 10:51 2025-04-03 UTC+2

توقعات الفوركس 03/04/2025: اليورو/الدولار الأمريكي، الدولار الأمريكي/الين الياباني، SP500، الذهب والبيتكوين

روابط مفيدة: مقالاتي الأخرى متوفرة في هذا القسم دورة InstaForex للمبتدئين التحليلات الشائعة افتح حساب تداول مهم: يجب على المبتدئين في تداول الفوركس أن يكونوا حذرين للغاية عند اتخاذ القرارات

Sebastian Seliga 09:57 2025-04-03 UTC+2

توقعات EUR/USD ليوم 3 أبريل 2025

اعتبارًا من اليوم، ستُفرض تعريفات جمركية أمريكية تتراوح بين 10% و50% على جميع شركاء التجارة الأمريكيين تقريبًا. كان المشاركون في السوق مستعدين وامتنعوا عن الذعر، على الرغم من ضعف مؤشرات

Laurie Bailey 05:07 2025-04-03 UTC+2

توقعات GBP/USD ليوم 3 أبريل 2025

GBP/USD بالأمس، أثرت التعريفات الجمركية الشاملة التي فرضها ترامب على شركاء التجارة الأمريكيين على المملكة المتحدة بأقل نسبة، حيث بلغت 10% فقط. في المقابل، تم تحديد التعريفات الجمركية على السلع

Laurie Bailey 05:07 2025-04-03 UTC+2

توقعات USD/JPY ليوم 3 أبريل 2025

USD/JPY بعد أن فرضت واشنطن تعريفة جمركية بنسبة 24% على الواردات اليابانية، انخفض مؤشر Nikkei 225 بنسبة 2.71% خلال جلسة المحيط الهادئ اليوم. زوج USD/JPY يتراجع بحوالي 150 نقطة

Laurie Bailey 05:07 2025-04-03 UTC+2

توقعات النفط ليوم 3 أبريل 2025

النفط (CL) يتوقع المشاركون في السوق حدوث اضطراب في التجارة العالمية بعد فرض الرئيس ترامب تعريفات جمركية شاملة أمس على جميع شركاء الولايات المتحدة التجاريين. في الرسم البياني اليومي، اخترق

Laurie Bailey 05:07 2025-04-03 UTC+2

#NDX – نتائج مارس وتوقعات أبريل

اختتم شهر مارس بشمعة هبوطية تركت علامة بارزة في كتب التاريخ. أغلق الدببة دون مستوى الاتجاه الشهري قصير الأجل (19,730) وأزالوا التقاطع الذهبي الأسبوعي، مختبرين الدعم عند الحد العلوي لسحابة

Evangelos Poulakis 01:07 2025-04-03 UTC+2

إشارات التداول لليورو/الدولار الأمريكي للفترة من 2 إلى 5 أبريل 2025: بيع تحت 1.0815 (21 SMA - +1/8 Murray)

إذا اخترق اليورو واستقر فوق قناة الاتجاه الهبوطي، يمكننا أن نتوقع وصوله إلى مستوى +1/8 Murray عند 1.0864 في الأيام القادمة. قد يصل زوج اليورو/الدولار الأمريكي حتى إلى مستوى +2/8

Dimitrios Zappas 15:18 2025-04-02 UTC+2

إشارات التداول للذهب (XAU/USD) للفترة من 2 إلى 5 أبريل 2025: بيع تحت مستوى 3,140 دولار أو شراء فوق مستوى 3,110 دولار (21 SMA - مثلث متماثل)

النمط المثلثي المتماثل الذي تم ملاحظته على الرسم البياني H4 يظهر أن الذهب قد يشهد دفعة صعودية قوية للوصول إلى 3,169، حيث تقع المقاومة R_1. أسفل هذه المنطقة، قد يحدث

Dimitrios Zappas 15:15 2025-04-02 UTC+2
لا تستطيع التحدث الآن؟
اطرح سؤالك في الدردشة.
Widget callback
 

Dear visitor,

Your IP address shows that you are currently located in the USA. If you are a resident of the United States, you are prohibited from using the services of InstaFintech Group including online trading, online transfers, deposit/withdrawal of funds, etc.

If you think you are seeing this message by mistake and your location is not the US, kindly proceed to the website. Otherwise, you must leave the website in order to comply with government restrictions.

Why does your IP address show your location as the USA?

  • - you are using a VPN provided by a hosting company based in the United States;
  • - your IP does not have proper WHOIS records;
  • - an error occurred in the WHOIS geolocation database.

Please confirm whether you are a US resident or not by clicking the relevant button below. If you choose the wrong option, being a US resident, you will not be able to open an account with InstaForex anyway.

We are sorry for any inconvenience caused by this message.