empty
24.03.2023 07:09 AM
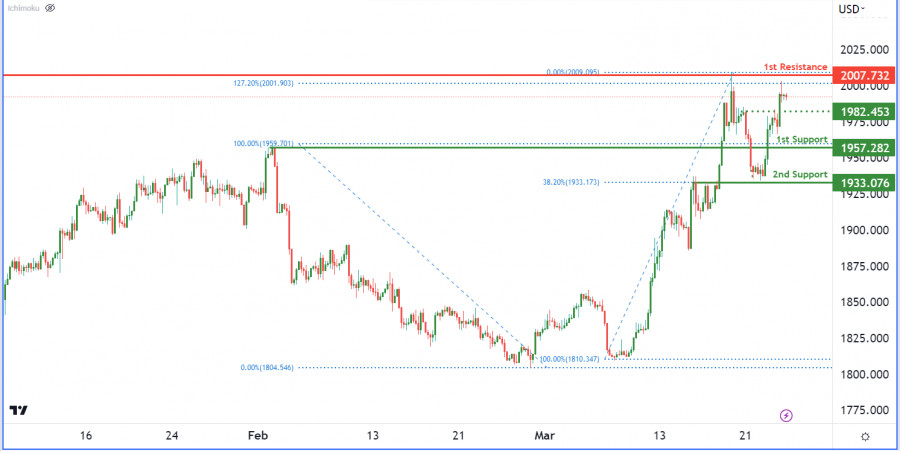
XAUUSD, H4 | Continue to 1st Support?

The XAU/USD chart currently has a bearish momentum, with potential for a bearish reaction off the first resistance level at 2007 and a drop towards the first support level at 1957. This support level has held prices up before and if broken, the price could drop towards the second support level at 1933. On the resistance side, the first resistance level is at 2007 with a 127% Fibonacci extension. An intermediate support level at 1982 could act as a pullback support if the price drops.

This image is no longer relevant

Dean Leo,
Analytical expert of InstaForex
© 2007-2025
Select timeframe
5
min
15
min
30
min
1
hour
4
hours
1
day
1
week
Earn on cryptocurrency rate changes with InstaForex
Download MetaTrader 4 and open your first trade
  • Grand Choice
    Contest by
    InstaForex
    InstaForex always strives to help you
    fulfill your biggest dreams.
    JOIN CONTEST
  • Chancy Deposit
    Deposit your account with $3,000 and get $10000 more!
    In January we raffle $10000 within the Chancy Deposit campaign!
    Get a chance to win by depositing $3,000 to a trading account. Having fulfilled this condition, you become a campaign participant.
    JOIN CONTEST
  • Trade Wise, Win Device
    Top up your account with at least $500, sign up for the contest, and get a chance to win mobile devices.
    JOIN CONTEST
  • 100% Bonus
    Your unique opportunity to get a 100% bonus on your deposit
    GET BONUS
  • 55% Bonus
    Apply for a 55% bonus on your every deposit
    GET BONUS
  • 30% Bonus
    Receive a 30% bonus every time you top up your account
    GET BONUS

Recommended Stories

EUR/USD. December 31. The Market Prepares for the New Year

On Monday, the EUR/USD pair returned to the 1.0420 level. Despite very low trader activity, the pair is not entirely stagnant. However, even if quotes close above the 1.0420 level

Samir Klishi 11:45 2024-12-31 UTC+2

GBP/USD. December 31. The Sideways Trend Continues

On the hourly chart, the GBP/USD pair rose to the resistance zone of 1.2611–1.2620 on Monday but failed to execute a rebound. For over a week now, the pair

Samir Klishi 11:37 2024-12-31 UTC+2

Trading Signals for EUR/USD for Decemeber 30-31, 2024: sell below 1.0450 (21 SMA - technical correction)

The eagle indicator is showing a positive signal, but we believe that a technical correction could follow since the instrument is overbought on the H1 chart. Hence, a drop

Dimitrios Zappas 16:20 2024-12-30 UTC+2

Trading Signals for GOLD (XAU/USD) for Decemeber 30-31, 2024: sell below $2,624 (21 SMA - 3/8 Murray)

On the contrary, if gold breaks and consolidates above 2,625 in the next few hours, the outlook could be positive and we could expect a recovery of gold with

Dimitrios Zappas 16:17 2024-12-30 UTC+2

Video analysis for December 30, 2024

Potential for the further drop in Gold

Petar Jacimovic 11:38 2024-12-30 UTC+2

Forex forecast 30/12/2024: EUR/USD, GBP/USD, USD/JPY, SP500 and Bitcoin

Video Agenda: 00:00 INTRO 00:15 Totay's key events: Nationwide HPI, Pending Home Sales, CFTC GBP speculative net positions, CFTC Crude Oil speculative net positions 01:07 EUR/USD 04:26 GBP/USD 05:33 USD/JPY

Sebastian Seliga 10:20 2024-12-30 UTC+2

EUR/USD Forecast for December 30, 2024

As the New Year approaches, the currency market remains relatively stable, although there are signs of a potential strong dollar rally across all financial markets. One key indicator

Laurie Bailey 04:09 2024-12-30 UTC+2

GBP/USD Forecast for December 30, 2024

On the daily chart, the price has slightly rebounded from the 1.2510 support level. This bounce represents the price's development within the consolidation range of 1.2510-1.2616. Friday's movement allowed

Laurie Bailey 04:09 2024-12-30 UTC+2

USD/JPY Forecast for December 30, 2024

The USD/JPY pair has settled within the 157.72-158.32 range. The Marlin oscillator is turning downward. These technical indicators, especially given the decline in stock indices, suggest a possible reversal toward

Laurie Bailey 04:09 2024-12-30 UTC+2

Gold - Technical Analysis of the Situation

The holiday season continues to impact the market, balancing opportunities and participant activity. Over the past week, the price range has been narrow. Current support is established at the weekly

Evangelos Poulakis 00:23 2024-12-30 UTC+2
Can't speak right now?
Ask your question in the chat.
Widget callback
 

Dear visitor,

Your IP address shows that you are currently located in the USA. If you are a resident of the United States, you are prohibited from using the services of InstaFintech Group including online trading, online transfers, deposit/withdrawal of funds, etc.

If you think you are seeing this message by mistake and your location is not the US, kindly proceed to the website. Otherwise, you must leave the website in order to comply with government restrictions.

Why does your IP address show your location as the USA?

  • - you are using a VPN provided by a hosting company based in the United States;
  • - your IP does not have proper WHOIS records;
  • - an error occurred in the WHOIS geolocation database.

Please confirm whether you are a US resident or not by clicking the relevant button below. If you choose the wrong option, being a US resident, you will not be able to open an account with InstaForex anyway.

We are sorry for any inconvenience caused by this message.