empty
10.04.2023 06:41 AM
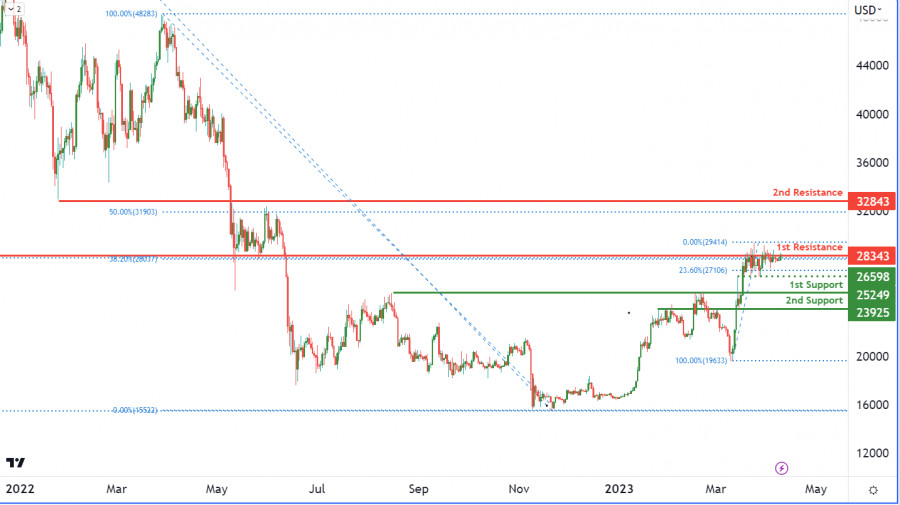
BTCUSD, Daily | Potential reversal from 1st resistance?

This image is no longer relevant

The BTC/USD chart currently reflects a bearish momentum in the cryptocurrency market, and Bitcoin seems to be following the trend. The chart suggests that the price of Bitcoin could face resistance at the 1st resistance level of 28343, which has previously been an important level as an overlap resistance. If Bitcoin fails to break through this level, it may result in a bearish reaction causing the price to drop towards the 1st support level of 25249. This level, being a pullback support, could act as a strong support for the price of Bitcoin.

In the event that the price of Bitcoin breaks through the 1st resistance level, the next resistance level it could face is the 2nd resistance level of 32843, which is a pullback resistance. Conversely, if Bitcoin breaks below the 1st support level, the next support level it could drop to is the 2nd support level of 23925. This level, also being a pullback support, could potentially act as a strong support for the price of Bitcoin.

Additionally, there is an intermediate support level at 26598, which is a swing low support and is accompanied by a 23.60% Fibonacci retracement. This level could potentially provide support to the price of Bitcoin if it drops towards the 1st support level. Overall, the BTC/USD chart's momentum is bearish, indicating that the price is expected to continue falling in the near term.

Dean Leo,
Especialista em análise na InstaForex
© 2007-2025
Selecionar intervalo de tempo
5
min
15
min
30
min
1
hora
4
horas
1
dia
1
s.
Ganhe com as variações das taxas das criptomoedas com a InstaForex.
Baixe o MetaTrader 4 e abra a sua primeira operação.
  • Grand Choice
    Contest by
    InstaForex
    InstaForex always strives to help you
    fulfill your biggest dreams.
    PARTICIPE DO CONCURSO

Recommended Stories

Sinais de negociação para EUR/USD para 26-28 de março de 2025: venda abaixo de 1,0808 (SMA 21 - 8/8 de Murray)

Com base no gráfico de 4 horas, o euro parece estar sobrevendido, e acreditamos que, se o EUR/USD encontrar um forte suporte em torno do nível 8/8 de Murray

Dimitrios Zappas 16:12 2025-03-26 UTC+2

Sinais de negociação para o OURO (XAU/USD) para 26-28 de março de 2025: venda abaixo de $3.034 (SMA 21 - 7/8 de Murray)

O ouro pode continuar seu ciclo de baixa nos próximos dias. Para confirmar essa tendência de baixa, devemos esperar uma consolidação abaixo de 3.020. Nesse caso, o preço pode atingir

Dimitrios Zappas 16:09 2025-03-26 UTC+2

Análise técnica do movimento intradiário de preços do índice Nasdaq 100, quarta-feira, 26 de março de 2025.

Podemos observar no gráfico de 4 horas que o par AUD/JPY está se movendo de forma consistente dentro de um canal de alta, negociando acima da média móvel exponencial

Arief Makmur 14:03 2025-03-26 UTC+2

Análise técnica do movimento intradiário de preços do índice Nasdaq 100, quarta-feira, 26 de março de 2025.

20405.7 Com o surgimento da convergência entre o movimento de preço do índice Nasdaq 100 e o indicador Oscilador Estocástico, e o índice sendo negociado acima da EMA (21)

Arief Makmur 13:59 2025-03-26 UTC+2

GBP/USD. 26 de março. A inflação pode movimentar a libra

No gráfico horário, o par GBP/USD continuou a ser negociado lateralmente na terça-feira, não mostrando nenhuma reação ao nível 1,2931. Portanto, um novo fechamento acima ou abaixo desse nível

Samir Klishi 13:49 2025-03-26 UTC+2

EUR/USD. 26 de março. Os ursos estão se preparando para um novo avanço

Na terça-feira, o par EUR/USD mais uma vez se recuperou da zona de suporte de 1,0781-1,0797, mas os touros mostraram fraqueza devido à falta de um histórico de notícias

Samir Klishi 13:31 2025-03-26 UTC+2

EUR/USD. 25 de março. Uma semana monótona pela frente

Na segunda-feira, o par EUR/USD se recuperou do nível de retração Fibonacci de 200,0%, em 1,0857, reverteu a favor do dólar americano e caiu em direção à zona de suporte

Samir Klishi 19:19 2025-03-25 UTC+2

GBP/USD. 25 de março. A libra entra em uma faixa lateral

No gráfico horário, o par GBP/USD se consolidou acima do nível 1,2931 na segunda-feira, mas os touros não conseguiram sustentar o movimento ascendente e recuaram. Posteriormente, o par voltou

Samir Klishi 18:46 2025-03-25 UTC+2

Sinais de negociação para o OURO (XAU/USD) para 25-27 de março de 2025: comprar acima de $3.024 (SMA 21 - 7/8 de Murray)

No início da sessão americana, o ouro está sendo negociado em torno de 3.021, abaixo da SMA 21, dentro do canal de tendência de baixa que se forma desde

Dimitrios Zappas 16:33 2025-03-25 UTC+2

Previsão para o EUR/USD para 25 de março de 2025

Na segunda-feira, o euro caiu 14 pips, mas houve uma tentativa de reversão para cima. Uma nova tentativa é possível hoje e pode ser mais bem-sucedida, embora o nível

Laurie Bailey 14:44 2025-03-25 UTC+2
Não pode falar agora?
Faça sua pergunta no chat.
Widget callback
 

Dear visitor,

Your IP address shows that you are currently located in the USA. If you are a resident of the United States, you are prohibited from using the services of InstaFintech Group including online trading, online transfers, deposit/withdrawal of funds, etc.

If you think you are seeing this message by mistake and your location is not the US, kindly proceed to the website. Otherwise, you must leave the website in order to comply with government restrictions.

Why does your IP address show your location as the USA?

  • - you are using a VPN provided by a hosting company based in the United States;
  • - your IP does not have proper WHOIS records;
  • - an error occurred in the WHOIS geolocation database.

Please confirm whether you are a US resident or not by clicking the relevant button below. If you choose the wrong option, being a US resident, you will not be able to open an account with InstaForex anyway.

We are sorry for any inconvenience caused by this message.