empty
20.11.2024 03:23 AM
Trading Recommendations and Trade Analysis for EUR/USD on November 20: The Euro Stuck in a Flat Trend

EUR/USD 5-Minute Analysis

This image is no longer relevant

On Tuesday, the EUR/USD currency pair again attempted an upward correction. As shown on the chart, the attempts were modest at best. The pair barely broke through recent local highs, and the movement over the past few days resembles a correction more than anything else. Nonetheless, the downtrend remains intact, and even if we see a stronger correction, it's probably not worth attempting to trade against the trend.

The euro is in a precarious position where its decline could resume. European Central Bank President Christine Lagarde provided no support for the euro during her Monday speech, avoiding any discussions about monetary policy. Another speech from her is scheduled this week, but it is unlikely to bring new or impactful information. As such, the euro remains fundamentally and macroeconomically unsupported. While a technical correction is possible, the market shows no interest in buying the pair at this time.

However, Tuesday's trading signals were reasonably solid. Initially, the pair consolidated below the critical line, though it was difficult to react in time to this signal. Later, a buy signal formed near the 1.0533 level, which was accurate and straightforward to execute. During the U.S. session, the price reached the Kijun-sen line and the 1.0581 level, where traders could lock in profits from long positions. Overall, it was a positive day for trading.

COT Report

This image is no longer relevant

The latest COT report, dated November 12, shows that the net position of non-commercial traders has remained bullish for a long time. The last attempt by bears to gain dominance failed. However, a month ago, professional traders significantly increased their short positions, leading to the net position turning negative for the first time in a long period. This indicates that the euro is now being sold more frequently than bought.

We still see no fundamental reasons for strengthening the euro, and technical analysis suggests the price remains in a consolidation zone—essentially a flat trend. On the weekly timeframe, it's clear that since December 2022, the pair has traded between 1.0448 and 1.1274. The market has transitioned from a seven-month flat phase to a 22-month phase. Thus, further decline remains likely toward 1.0448, which is only a short distance away.

Over the last reporting week, the number of long positions among the non-commercial group increased by 100, while short positions decreased by 14,100, causing the net position to grow by 14,200. The euro's downside potential remains significant.

EUR/USD 1-Hour Analysis

This image is no longer relevant

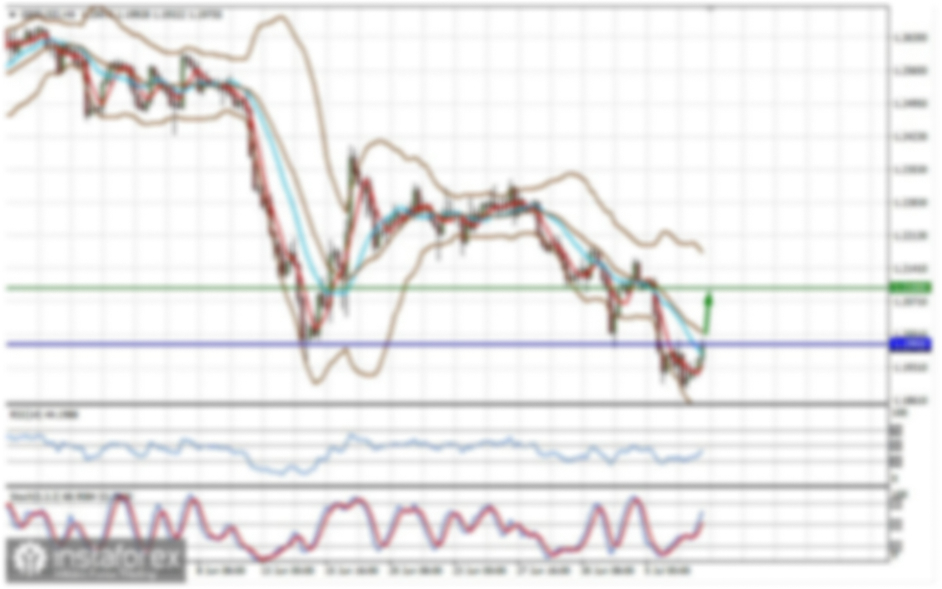
On the hourly timeframe, the pair continues to develop its downtrend. There's no need to discuss fundamental or macroeconomic drivers for the dollar's medium-term decline—they're absent. We expect the euro's decline to persist in the medium term. It's becoming increasingly apparent that the market has fully priced in the Federal Reserve's monetary easing cycle, and the Fed is now showing no urgency to lower rates further, as this has already been priced in. The euro's only hope is a technical correction.

For November 20, we highlight the following levels for trading: 1.0340-1.0366, 1.0485, 1.0581, 1.0658-1.0669, 1.0757, 1.0797, 1.0843, 1.0889, 1.0935, 1.1006, as well as the Senkou Span B (1.0767) and Kijun-sen (1.0575) lines. The Ichimoku indicator lines may shift during the day, so keep that in mind when determining trading signals. Remember to place a Stop Loss at breakeven if the price moves 15 pips in the intended direction, to safeguard against potential losses from false signals.

No significant macroeconomic reports are scheduled in the Eurozone on Wednesday. In the second half of the day, Lagarde will give another speech, but we don't expect any substantial or impactful information. The U.S. economic calendar is similarly barren, containing no notable events.

Chart Explanations:

Support and resistance levels: thick red lines around which movement may end. They are not sources of trading signals.

Kijun-sen and Senkou Span B lines: Ichimoku indicator lines transferred from the 4-hour to the 1-hour timeframe. These are strong lines.

Extreme levels: thin red lines where the price previously rebounded. They are sources of trading signals.

Yellow lines: Trend lines, trend channels, and other technical patterns.

Indicator 1 on COT charts: The net position size for each category of traders.

Paolo Greco,
Especialista em análise na InstaForex
© 2007-2025
Selecionar intervalo de tempo
5
min
15
min
30
min
1
hora
4
horas
1
dia
1
s.
Ganhe com as variações das taxas das criptomoedas com a InstaForex.
Baixe o MetaTrader 4 e abra a sua primeira operação.
  • Grand Choice
    Contest by
    InstaForex
    InstaForex always strives to help you
    fulfill your biggest dreams.
    PARTICIPE DO CONCURSO

Recommended Stories

Recomendações e análise de negociação para o GBP/USD em 10 de fevereiro

O par GBP/USD voltou a se recuperar a partir de sua linha de tendência ascendente na sexta-feira, sugerindo uma possível continuação da tendência de alta. Na segunda-feira, o par sofreu

Paolo Greco 16:51 2025-02-10 UTC+2

Recomendações de negociação e análise de negociação para o EUR/USD em 10 de fevereiro

O par EUR/USD apresentou movimentos de preço consistentes na sexta-feira, embora o dólar norte-americano tenha se fortalecido no final do dia. No entanto, seus ganhos não foram expressivos

Paolo Greco 15:38 2025-02-10 UTC+2

GBP/USD: Plano de negociação para a sessão dos E.U.A. de 4 de fevereiro (análise das negociações da manhã)

Na minha previsão da manhã, concentrei-me no nível 1,2423 e planejei tomar decisões de negociação com base nele. Vamos analisar o gráfico de 5 minutos para entender o que aconteceu;

Miroslaw Bawulski 21:59 2025-02-04 UTC+2

EUR/USD: Plano de Negociação para a Sessão dos E.U. de 3 de fevereiro (Revisão das Negociações da Manhã). O euro consegue se manter acima de 1,0216

Em minha previsão da manhã, destaquei o nível 1,0214 como um ponto-chave de decisão para entradas no mercado. Vamos dar uma olhada no gráfico de 5 minutos para

Miroslaw Bawulski 21:24 2025-02-03 UTC+2

EUR/USD: Plano de Negociação para a Sessão dos E.U.A de 31 de janeiro (Análise das Negociações da Manhã)

Em minha previsão matinal, destaquei o nível 1,0377 como um ponto de referência importante para decisões de entrada. Vamos analisar o gráfico de 5 minutos para ver o que aconteceu

Miroslaw Bawulski 15:52 2025-01-31 UTC+2

EUR/USD: Plano de Negociação para a Sessão dos E.U.A. de 30 de janeiro (Revisão das Negociações da Manhã)

Em minha previsão da manhã, destaquei o nível 1,0390 como um ponto-chave de entrada. No entanto, devido à baixa volatilidade, o par não atingiu esse nível para uma formação

Miroslaw Bawulski 21:15 2025-01-30 UTC+2

GBP/USD: Plano de Negociação para a Sessão dos E.U.A. de 30 de janeiro (Revisão das Negociações da Manhã)

Em minha previsão matinal, enfatizei 1,2460 como um nível-chave para entradas no mercado. Observando o gráfico de 5 minutos, o falso rompimento em 1,2460 proporcionou uma excelente oportunidade de venda

Miroslaw Bawulski 21:02 2025-01-30 UTC+2

GBP/USD: Plano de Negociação para a Sessão dos E.U.A. de 29 de janeiro (Revisão das Negociações da Manhã)

Em minha previsão da manhã, destaquei 1,2415 como um nível-chave para a entrada no mercado. Vamos analisar o gráfico de 5 minutos para ver o que aconteceu. O par caiu

Miroslaw Bawulski 20:13 2025-01-29 UTC+2

EUR/USD: Plano de Negociação para a Sessão dos E.U.A. de 29 de janeiro (Revisão das Negociações da Manhã)

Em minha previsão da manhã, destaquei o nível 1,0415 como um ponto-chave para tomar decisões de negociação. Vamos examinar o gráfico de 5 minutos para analisar o que aconteceu

Miroslaw Bawulski 20:01 2025-01-29 UTC+2

EUR/USD: Plano de negociação para a sessão dos E.U.A. de 28 de janeiro (análise das negociações da manhã)

Na minha previsão da manhã, destaquei o nível 1,0415 e planejei tomar decisões de negociação em torno dele. Vamos analisar o gráfico de 5 minutos para ver o que aconteceu

Miroslaw Bawulski 20:21 2025-01-28 UTC+2
Não pode falar agora?
Faça sua pergunta no chat.
Widget callback
 

Dear visitor,

Your IP address shows that you are currently located in the USA. If you are a resident of the United States, you are prohibited from using the services of InstaFintech Group including online trading, online transfers, deposit/withdrawal of funds, etc.

If you think you are seeing this message by mistake and your location is not the US, kindly proceed to the website. Otherwise, you must leave the website in order to comply with government restrictions.

Why does your IP address show your location as the USA?

  • - you are using a VPN provided by a hosting company based in the United States;
  • - your IP does not have proper WHOIS records;
  • - an error occurred in the WHOIS geolocation database.

Please confirm whether you are a US resident or not by clicking the relevant button below. If you choose the wrong option, being a US resident, you will not be able to open an account with InstaForex anyway.

We are sorry for any inconvenience caused by this message.