empty
20.12.2024 01:11 PM
Forecast for EUR/USD on December 20th

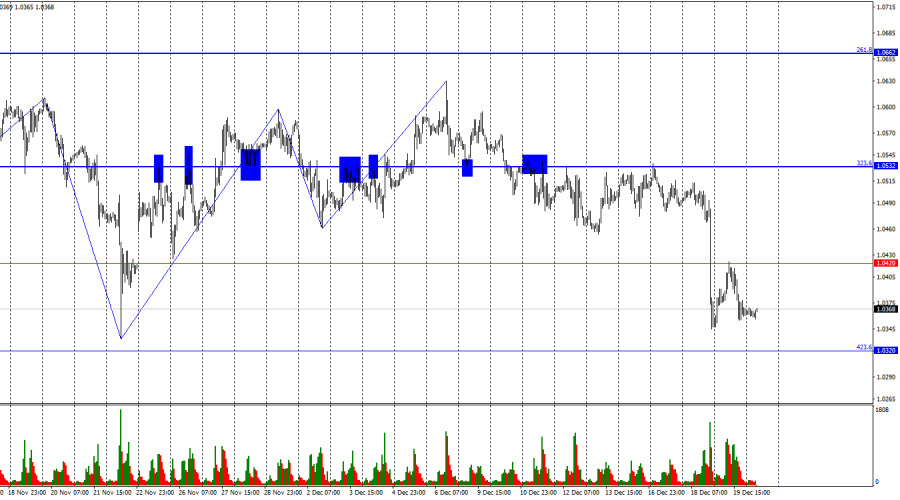
On Thursday, the EUR/USD pair rose to the 1.0420 corrective level, rebounded, and reversed in favor of the U.S. dollar. The downward process resumed toward the 423.6% corrective level at 1.0320. A rebound from 1.0320 could signal a reversal in favor of the euro and a rise toward 1.0420. However, a close below 1.0320 would increase the likelihood of further declines toward the next level at 1.0225 (4-hour chart).

This image is no longer relevant

The wave structure is simple and clear. The last completed upward wave barely broke the previous peak, while the last downward wave easily broke the previous low. This indicates that the formation of the "bullish" trend is now complete. As I previously suggested, it was weak. A further decline in the euro is expected as part of a new trend.

The information backdrop on Thursday was much weaker for both the euro and the dollar, yet the overall dynamic remained intact. Traders continue to process the outcomes of the Federal Reserve meeting. Although the euro saw a slight recovery, it quickly gave up its gains. In my view, global events such as the Fed meeting can influence trader sentiment for an extended period. Bears currently have informational support.

To recap, the Fed decided to cut rates again, but it signaled a strong likelihood of more pauses than rate cuts in 2025. Traders were not expecting that the FOMC would plan only two 0.25% rate cuts for 2025. This divergence between the ECB and Fed's rate policies could widen next year, further disadvantageing the euro. I believe bears will continue to dominate, and a move below 1.0320 is just a matter of time.

This image is no longer relevant

On the 4-hour chart, the pair has bounced twice from the 100.0% corrective level at 1.0603 and continues to decline toward the 161.8% Fibonacci level at 1.0225. A "bearish" divergence in the CCI indicator also pushed prices lower. A consolidation above 1.0436 could signal a recovery toward 1.0603. No new divergences are observed on any indicators today.

Commitments of Traders (COT) Report

This image is no longer relevant

During the last reporting week, speculators closed 10,318 long positions and opened 7,766 short positions. The sentiment among the "Non-commercial" group remains "bearish" and is strengthening, suggesting further declines for the pair. The total number of long positions held by speculators is now 157,000, compared to 233,000 short positions.

For 13 consecutive weeks, major players have been offloading the euro. In my view, this indicates a "bearish" trend. The key factor behind the dollar's decline—expectations of Fed easing—has already been priced in. The market now has fewer reasons to sell the dollar. While these reasons might emerge over time, the U.S. dollar remains poised for further growth. Technical analysis also supports the start of a long-term "bearish" trend, and I expect the EUR/USD pair to experience a prolonged decline.

News Calendar for the U.S. and Eurozone

  • U.S.: Core PCE Index (13:30 UTC)
  • U.S.: Personal Income and Expenditure (13:30 UTC)
  • U.S.: University of Michigan Consumer Sentiment Index (15:00 UTC)

The economic calendar for December 20 contains a few moderately significant entries. The impact of these events on market sentiment is expected to be minimal.

Forecast for EUR/USD and Trading Tips

Selling the pair was possible after a bounce from the 1.0603 level on the 4-hour chart, targeting 1.0420 and 1.0320. The first target has been met, and the second is nearly reached. Yesterday, sales were viable following a bounce from 1.0420 on the hourly chart. Buying will be possible if the pair bounces from 1.0320 on the hourly chart, though I would still avoid risking purchases at this time.

Fibonacci levels are plotted from 1.1003–1.1214 on the hourly chart and from 1.0603–1.1214 on the 4-hour chart.

Seleccione el marco de tiempo
5
min
15
min
30
min
1
hora
4
horas
1
día
1
s.
Gana con los cambios en el valor de las criptomonedas con InstaForex.
Descarga MetaTrader 4 y abre tu primera operación.
  • Grand Choice
    Contest by
    InstaForex
    InstaForex always strives to help you
    fulfill your biggest dreams.
    UNIRSE AL CONCURSO

Recommended Stories

Análisis técnico para la semana del 16 al 21 de diciembre, del par de divisas GBP/USD.

La semana pasada, el par, moviéndose hacia abajo, rompió el nivel de retroceso del 14,6% – 1,2624 (línea de puntos azul), cerrando la vela semanal en 1,2618. Durante la próxima

Stefan Doll 09:17 2024-12-16 UTC+2

EUR/USD. 10 de diciembre. Los toros agotaron su potencial.

Buenos días, estimados traders. El par EUR/USD el lunes realizó un rebote desde el nivel de corrección del 323,6% – 1,0532, una ligera subida y un regreso al nivel 1,0532

Samir Klishi 11:31 2024-12-10 UTC+2

GBP/USD. 10 de diciembre. La libra está estancada y esperando la inflación estadounidense

Buenos días, estimados traders. En el marco temporal de una hora, el par GBP/USD el lunes volvió a la zona de resistencia 1,2788–1,2801, rebotó desde ella, giró a favor

Samir Klishi 11:31 2024-12-10 UTC+2

Pronóstico para el par EUR/USD del 24 de junio de 2024

EUR/USD La caída del euro del viernes no fue grande, pero sí cualitativa: los índices bursátiles, las materias primas y los metales preciosos bajaron junto con él. El par EUR/USD

Laurie Bailey 09:00 2024-06-24 UTC+2

Pronóstico del par GBP/USD para el 24 de junio de 2024

GBP/USD La libra esterlina bajó 13 pips el viernes. Se detuvo en la línea Kruzenshtern de la escala diaria. Esta mañana el precio se está consolidando en esta línea, probablemente

Laurie Bailey 08:53 2024-06-24 UTC+2

Pronóstico del par USD/JPY para el 24 de junio de 2024

USD/JPY El viernes, el dólar repitió el carácter impulsivo de la subida del jueves, saltando 86 pips. El nivel objetivo de 160,40 ya está cerca, y supera el máximo

Laurie Bailey 08:40 2024-06-24 UTC+2

Análisis técnico para la semana, del 20 al 25 de mayo, par de divisas GBP/USD

La semana pasada el par subió, rompió el nivel de retroceso del 23,6%, 1,2690 (línea de puntos azul) y subió, cerrando la vela semanal en 1,2697. En la próxima semana

Stefan Doll 10:32 2024-05-20 UTC+2

Análisis técnico para la semana, del 20 al 25 de mayo, par de divisas EUR/USD

La semana pasada, el par se movió al alza, probó el nivel de retroceso del 76,4%, 1,0891 (línea de puntos roja), bajó un poco y cerró la vela semanal

Stefan Doll 10:32 2024-05-20 UTC+2

EUR/USD. 7 de mayo. La fuerza de los toros se está agotando

¡Buenas tardes, queridos traders! El par EUR/USD volvió el lunes a la zona de resistencia de 1,0785-1,0797, que forma parte de la zona de resistencia más amplia de 1,0764-1,0806

Samir Klishi 12:10 2024-05-07 UTC+2

EUR/USD y GBP/USD el 26 de abril - análisis técnico de la situación

Ayer, los alcistas siguieron ganando terreno. La zona de resistencia más cercana sigue siendo el área de 1,0744 - 1,0756, que combina los niveles diarios y semanales. En caso

Evangelos Poulakis 12:51 2024-04-26 UTC+2
¿No puede hablar ahora mismo?
Ingrese su pregunta en el chat.
Widget callback
 

Dear visitor,

Your IP address shows that you are currently located in the USA. If you are a resident of the United States, you are prohibited from using the services of InstaFintech Group including online trading, online transfers, deposit/withdrawal of funds, etc.

If you think you are seeing this message by mistake and your location is not the US, kindly proceed to the website. Otherwise, you must leave the website in order to comply with government restrictions.

Why does your IP address show your location as the USA?

  • - you are using a VPN provided by a hosting company based in the United States;
  • - your IP does not have proper WHOIS records;
  • - an error occurred in the WHOIS geolocation database.

Please confirm whether you are a US resident or not by clicking the relevant button below. If you choose the wrong option, being a US resident, you will not be able to open an account with InstaForex anyway.

We are sorry for any inconvenience caused by this message.